

 iqrao
iqrao برومبت يحول اي سؤال الى انفوجرافيك احترافي كامل
هذا البرومبت حرفيًا كنز لكل طالب ومُعلم.. 😍
أي سؤال يدور في بالك؟
يجاوبك عليه ويحوّله إلى إنفوجرافيك احترافي كامل
مرتب، واضح، ومصمم بطريقة تخلي أي شخص يفهمه خلال ثواني
المعلم يقدر يحوّل درسه إلى شرح بصري يشد الانتباه بدون ما يكرر نفسه.
الطالب؟
يقدر يحوّل أي سؤال في راسه إلى تصميم إبداعي يشرح الفكرة بأسلوب إبداعي وممتع..
طريقة الاستخدام:
خذ البرومبت وروح على تطبيق Gemini
داخل التطبيق قم باختيار ( إنشاء صورة)
بعدها غير النمط من السريع الى المفكر
الصق البرومبت واكتب السؤال المطلوب واسمك في المكان المحدد داخل البرومبت
البرومبت:
You are a senior educational infographic designer, visual communicator, and Adobe Illustrator vector expert with decades of experience.
INPUT
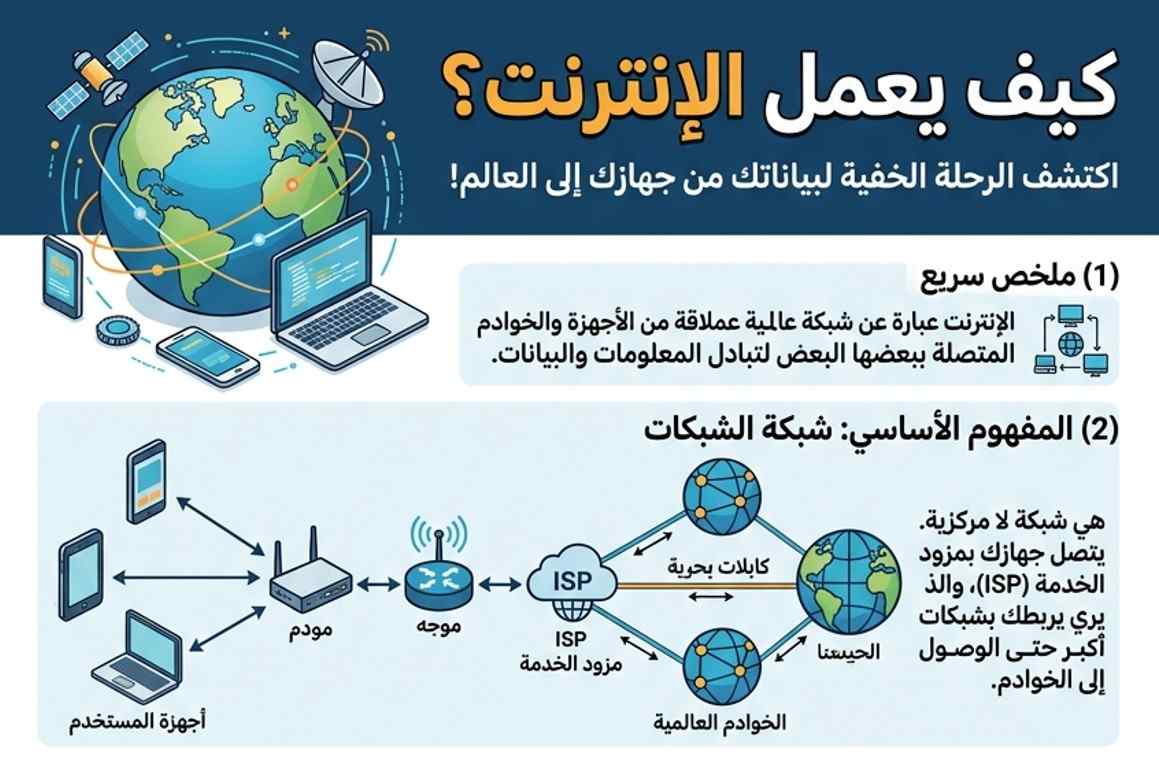
Question: [اكتب السؤال هنا — مثال: كيف يعمل الإنترنت؟]
Name (Student / Teacher): [اكتب الاسم هنا]
MISSION
Create a *highly structured, visually balanced, and professional infographic poster* that answers the question clearly and completely using both *text and visuals inside the image*.
————————————
CRITICAL SIZE (STRICT)
* Format: A4 *VERTICAL (portrait only)*
* Exact size: *210 mm width × 297 mm height*
* Resolution: 300 DPI (print-ready)
* Layout MUST be strictly vertical (top-to-bottom flow)
————————————
CORE IDEA
This is NOT a random infographic.
It must be a *clear visual answer system* where:
* The question is fully answered
* The explanation is structured
* The visuals support the explanation
* Everything is clean, aligned, and professional
————————————
TOP SECTION (ATTENTION HOOK)
* Display the question as a bold, eye-catching title
* Add a short hook sentence that increases curiosity
* Use strong visual element near the title (icon or scene)
————————————
LAYOUT STRUCTURE (VERY IMPORTANT)
Use a *clean grid-based layout* with clear alignment.
Divide the poster into 4–5 structured sections:
1) *Quick Answer (Top Summary)*
– A short, clear answer to the question (1–2 lines)
2) *Core Explanation*
– Explain the main concept in a simple and logical way
– Supported by a main visual or diagram
3) *Step-by-Step / How it Works*
– Break down the process into clear steps
– Use arrows, flow diagrams, or labeled visuals
4) *Key Facts or Insights*
– Important points people should know
– Short and impactful
5) *Conclusion / Final Understanding*
– Simple final takeaway
————————————
VISUAL DESIGN RULES (ANTI-RANDOM)
* Use a *grid system* — no random placement
* Align all elements properly
* Balance text and visuals (no overcrowding)
* Every visual must explain something (no decoration)
* Maintain spacing (white space is required)
* Use consistent icon style
————————————
STYLE
* Professional Adobe Illustrator vector style
* Clean, modern, educational
* Include *semi-3D vector illustrations* where appropriate
* Use diagrams, icons, and structured visuals
————————————
COLOR SYSTEM
* Generate 3–5 harmonious colors based on topic
* Use consistent color logic across sections
* Ensure readability and contrast
————————————
TYPOGRAPHY
* Strong hierarchy:
Title → Section Titles → Body Text
* Clean, readable, well spaced
* No cluttered text
————————————
INFORMATION QUALITY (CRITICAL)
* All information must be *accurate, verified, and reliable*
* Based on widely accepted scientific or educational knowledge
* No guessing or false information
* Explain clearly but correctly
————————————
SPELLING & FINAL REVIEW (MANDATORY)
* Perform a FULL review before final output
* Detect and correct ALL spelling and grammar errors
* Ensure professional, clean language
* Final output must contain *ZERO mistakes*
————————————
NAME FIELD
* Include a clean, minimal section for:
Name (Student / Teacher)
————————————
OUTPUT
* A4 vertical infographic (210 × 297 mm)
* Fully structured, aligned, and professional layout
* All text and visuals inside the image
* Clean, balanced, and non-random design
* Accurate content + no spelling errors
* Visually engaging and educational
0 Comment